Networks 3.0: Defined by digital dimensions
In the third quarter of 2016, the markets cheered a milestone event: The five most valuable public companies (by market capitalization) were, for the first time, all technology companies.

While sharing in the enthusiasm and noting the significance of the event, one feels that this is an overly simplified assessment. Most companies and virtually all sectors are now dominated by technology, and distinctions between “tech” and “non-tech” are more truly about context and degree. Even when confined to companies that sell technology, the category is varied in use cases, format, scope, customers and business models.
And so, the questions: Why these five? What drove their ascent? Do they share important similarities and what are their differences? Are these conventional technology companies that have adapted to the environment best? Or… have they shaped a new category that defines the emerging environment?
As this leadership profile hasn’t formed suddenly, but appears rather as the culmination of a multi-year trend, it seems unlikely to quickly reverse; and there are lessons to be learned from market leaders in a substantive and transformative trend.

If the companies share certain traits, identifying these may deepen our understanding of the trend itself. For a variety of reasons, the investigation has its merits:
- Strategy and planning
- Competitive assessment
- Opportunity and risk considerations
- Financial evaluation
Thesis
The referenced “top-5” are representative of new networks* with new network effects, launched from a springboard of popular technology, perpetuated by multiple levels of data capture, enabled by (and enabling) multiple related products and applications.
As networks have evolved from communication and infrastructure (1.0) to digital interactivity (2.0), there is now a new network manifestation (3.0) that is more broadly scoped, intelligent, robust and built on three dimensions.
*Note: Platforms and marketplaces are included in this “network” classification, mindful of the technical distinction, but recognizing that these all form network topologies with network effects in their respective ways.
Illustrations
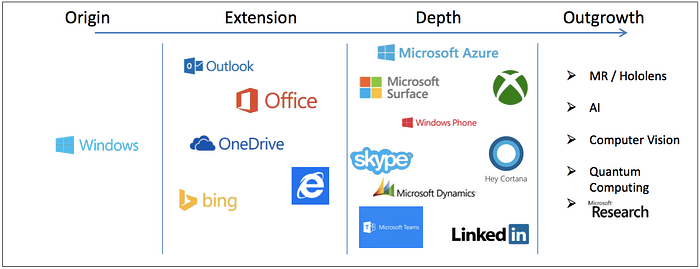
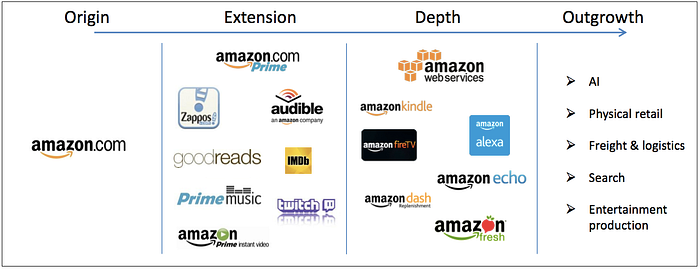
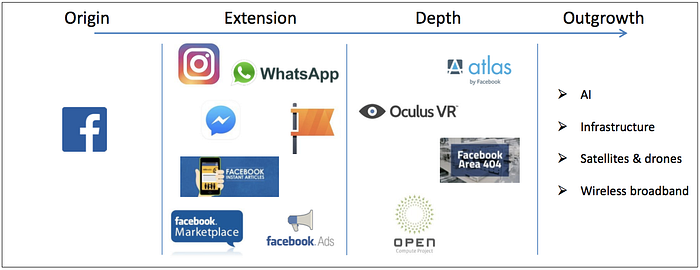
In the five images that follow, a high-level profile of the network evolution of each subject company is presented, seeking to highlight distinct network levels and interrelations, ordered in thematic (rather than chronological) sequence, and organized to underscore a common structure that guides the otherwise individual natures.
In the subsequent section a unified blueprint will be shown, summarizing the pattern that is seen consistently among these cases. There will be a commentary, in conclusion, about the relevance of this interpretation to strategic and financial investors in this new environment.
Apple: The integrated and ubiquitous experience

Alphabet: The global information hub

Microsoft: The enterprise “consummerized”
Amazon: The commercial ecosystem
Facebook: The social communication exchange
Blueprint
While the classification of extensions and depth in the presented images can be an arbitrary exercise — with “extensions” intended to signify additions of a horizontal nature to the original asset, helping to increase market share or share of market attention; and “depth” meant to depict whole new layers, either technologically or by the addition of new products or complexity to the established system — the important thing is the recognition of added dimensions.
A consistent format manifests itself, pointing to a new variety of network effects, based on the deepening of data sets, the growth of network layers, and a resulting enrichment of the offering. The sequence is more or less as follows:
- The original core asset: from which the opportunity evolves
- First network effect: original product functionality improves with usage
- First data wealth: network effects enrich the data sets
- Network expansion: related product introductions add to depth of data layers
- Second network effect: network reach and data depth enrich the evolving asset and its integrated network products, improving the portfolio with usage and new network dimensions
- Optionality: opportunities for growth emerge from the deep new network asset

Commentary
There is a limited life to technologies and products in a software-based, high-disruption environment, leading to the increasing commoditization of both. As business and consumer offerings are increasingly challenged for differentiation, networks and their particular effects are emerging as the most effective and sustainable value creation.
The value of networks in the “3.0” era is no longer driven by size alone, but also by network depth and its resulting optionality, as “big data” evolves to more valuable “deep data.” (A noted side-effect of the event is a “winner takes most” dynamic that circularly extends the network itself and adds to its dimensions and data wealth.)
Numerous new categories are taking shape, and data-based activities are expanding, directly related to the themes presented:
- Machine learning
- Machine connectivity and optimization
- Multi-sided marketplaces
- Information exchanges
- Internet of things (IoT)
- Software subscription services
- Mapping and logistics
- Monitoring and alerts
These technology categories with their network branches are reaching into areas far beyond the “technology” sector narrowly defined. The impact is increasingly felt across industries. While some traditional sectors have been substantially transformed already — for instance, media, finance, and retail — several others are now showing signs of transformation, with the advent of new methods and new qualities as illustrated. Of note: automotive, education, industrial, energy, health.
For these reasons, the blueprint that was outlined and its related observations may be generally followed or reinterpreted, with variations and differences in perspective according to circumstance…
- by startups to build valuable networks in a “winner takes most” environment
- by more mature businesses to branch out or reposition to defend with network effects against product or technology disruption that may occur
- by strategic buyers to identify long-term needs in building, expanding, or enhancing their networks
- by strategic sellers to identify potential targets, fit and opportunities to add value
- by investors and other funding sources to assess upside, sustainability and risk
Finally, there is an opportunity in markets (perhaps with the support of academia) to shape new economic and financial analytics, factoring in particular network qualities (e.g., density, clustering, directionality, engagement) and related KPIs (e.g., CAC, CLV), in order to arrive at substantive quantification of such variables in terms of network value formation.
We are watching, and hope to contribute.
Related reading:
Ten questions for the new economist
Finance notes from underground
Markets and the year(s) ahead: Post-digital edition
Networks, products and their relativity